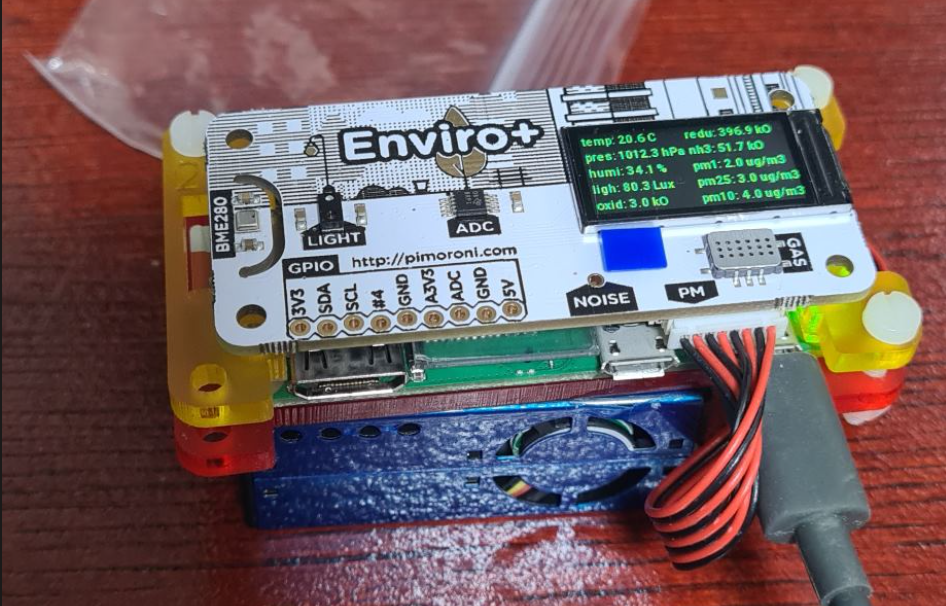
Finishing off what we did in Part 1 and Part 2 for this, we are now going to take what we did in part 1 which was setup the RaspberryPi and capture data from the Enviro+ pHAT sensor board and in part 2 which was setup Azure IoT hub and capture data sent from a Python script to Azure and present it in a PowerBi dashboard.
In this part we will look at how to get the data from the Enviro+ into Azure and present it via PowerBi.
To start this off we are going to look at some of the example scripts that are provided by Pimoroni to understand how they are getting data. The main script we will look at is the combind.py script which captures the data from the various sensors and outputs the data onto the provided LCD board. Drilling into the combind.py script, the first thing we see is the modules it imports:
import ltr559
from bme280 import BME280
from pms5003 import PMS5003, ReadTimeoutError as pmsReadTimeoutError, SerialTimeoutError
from enviroplus import gas
These seem to be the key libraries that the script uses and looking further down at the script these modules appear to do all the heavy lifting of pulling data. The script seems to just pull the data by executing these libraries and pass them as variables:
# BME280 temperature/pressure/humidity sensor
bme280 = BME280()

# PMS5003 particulate sensor
pms5003 = PMS5003()
and pulling the individual meter data and presenting it on the LCD:
raw_data = bme280.get_pressure()
                save_data(1, raw_data)
                display_everything()
                raw_data = bme280.get_humidity()
                save_data(2, raw_data)
                if proximity < 10:
                    raw_data = ltr559.get_lux()
                else:
                    raw_data = 1
                save_data(3, raw_data)
                display_everything()
                gas_data = gas.read_all()
                save_data(4, gas_data.oxidising / 1000)
                save_data(5, gas_data.reducing / 1000)
                save_data(6, gas_data.nh3 / 1000)
These lines of code seem to be doing all the data gathering for all the sensors which is great cause all we need to do is change this from sending it to the LCD to sending it as a JSON message to Azure.
The next thing we need to understand is what data we are capturing and what the Unit of measure is for each of the item, which is presented in the dictionary definitions below:
# Create a values dict to store the data
variables = ["temperature",
             "pressure",
             "humidity",
             "light",
             "oxidised",
             "reduced",
             "nh3",
             "pm1",
             "pm25",
             "pm10"]

units = ["C",
         "hPa",
         "%",
         "Lux",
         "kO",
         "kO",
         "kO",
         "ug/m3",
         "ug/m3",
         "ug/m3"]
One other interesting section of the code to note is the capturing of the Temperature. Because all the components on the boards are soo close together the temperature reading can be skewered because the heat from components can drive the temperature up soo to compensate for that, the code pulls average temperature data from the Pi’s internal CPU Temp sensor and subtracts it from the raw data it gets from the bme280 sensor:
# Tuning factor for compensation. Decrease this number to adjust the
    # temperature down, and increase to adjust up
    factor = 2.25

    cpu_temps = [get_cpu_temperature()] * 5

 # variable = "temperature"
                unit = "C"
                cpu_temp = get_cpu_temperature()
                # Smooth out with some averaging to decrease jitter
                cpu_temps = cpu_temps[1:] + [cpu_temp]
                avg_cpu_temp = sum(cpu_temps) / float(len(cpu_temps))
                raw_temp = bme280.get_temperature()
                data = raw_temp - ((avg_cpu_temp - raw_temp) / factor)
                display_text(variables[mode], data, unit)
Now that we have an understanding on what data we need to capture and how to capture it, we can modify this script to also include the Azure IoT work we did in part 2. We will first start off by setting up a new MSG_SEND String for sending all the data:
MSG_SND = '{{"messageId": 100,"deviceId": "Raspberry Pi Web Client","temperature (C)": {temperature},"humidity (%)": {humidity},"pressure (hPa)":{pressure},"light (lux)":{light},"oxidied (kO)":{oxidised},"reduced (kO)":{reduced},"nh3 (kO)":{nh3},"pm1 (ug/,3)":{pm1},"pm25 (ug/,3)":{pm25},"pm10 (ug/,3)":{pm10}}}' The next is to create a function to capture the temperature:
def get_temp():
    # Tuning factor for compensation. Decrease this number to adjust the
    # temperature down, and increase to adjust up
    factor = 2.25
    cpu_temps = [get_cpu_temperature()] * 5
    cpu_temp = get_cpu_temperature()
    # Smooth out with some averaging to decrease jitter
    cpu_temps = cpu_temps[1:] + [cpu_temp]
    avg_cpu_temp = sum(cpu_temps) / float(len(cpu_temps))
    raw_temp = bme280.get_temperature()
    temp = raw_temp - ((avg_cpu_temp - raw_temp) / factor)
    return temp
Last but not least creating our function to capture all the telemetry data and update the message and send it to Azure IoT:
async def iothub_client_telemetry_sample_run():
    try:
        client = iothub_client_init()
        print ( "Sending data to IoT Hub, press Ctrl-C to exit" )

        temp = get_temp()
        pressure = bme280.get_pressure()
        humidity = bme280.get_humidity()
        lux = ltr559.get_lux()
        gas_data = gas.read_all()
        oxidised = (gas_data.oxidising / 1000)
        reducing = (gas_data.reducing / 1000)
        nh3 = (gas_data.nh3 / 1000)
        try:
            pms_data = pms5003.read()
        except (SerialTimeoutError, pmsReadTimeoutError):
            logging.warning("Failed to read PMS5003")
        else:
            pm1 = float(pms_data.pm_ug_per_m3(1.0))
            pm25 = float(pms_data.pm_ug_per_m3(2.5))
            pm10 = float(pms_data.pm_ug_per_m3(10))

        await client.connect()
        msg_txt_formatted = MSG_SND.format(temperature=temp, humidity=humidity, pressure=pressure, light=lux, oxidised=oxidised, reduced=reducing, nh3=nh3, pm1=pm1, pm25=pm25, pm10=pm10)
        message = msg_txt_formatted
        print( "Sending message: {}".format(message) )
        await client.send_message(message)
        print ( "Message successfully sent" )
        time.sleep(3)
        await client.disconnect()
        time.sleep()
As a cheat what I did was use the combind.py script and added my functions to the same script soo it would continue show the data on the LCD and at the same time upload the data onto Azure. For a full copy of my script check out my github site here.
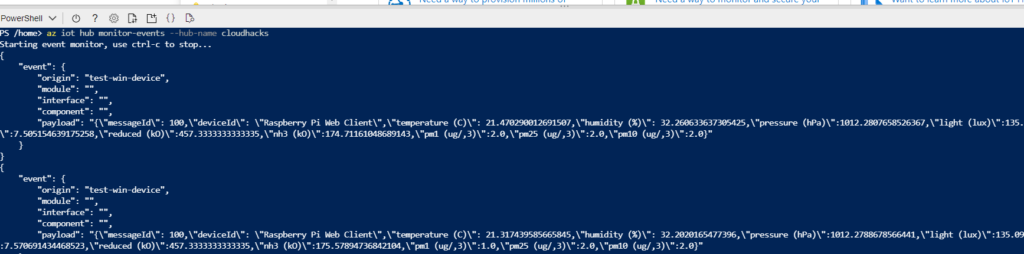
Running the script we see the script outputting the captured data both locally but also sending it to Azure IoT:
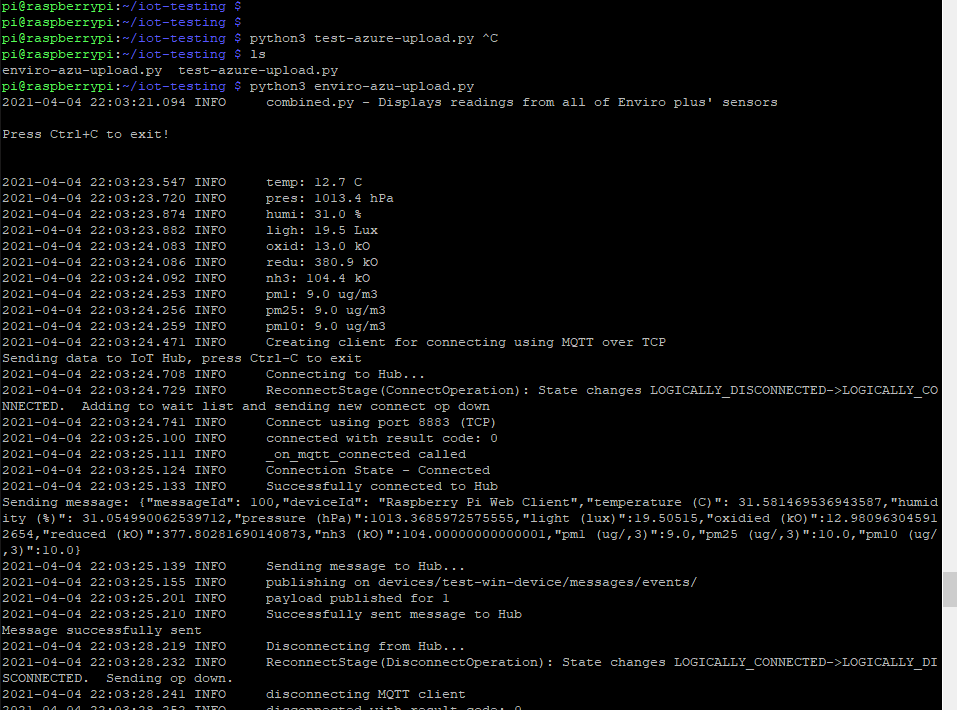
Data being received by Azure IoT:
Using the same data stream that was setup in Part 2. We can get the data in PowerBi:
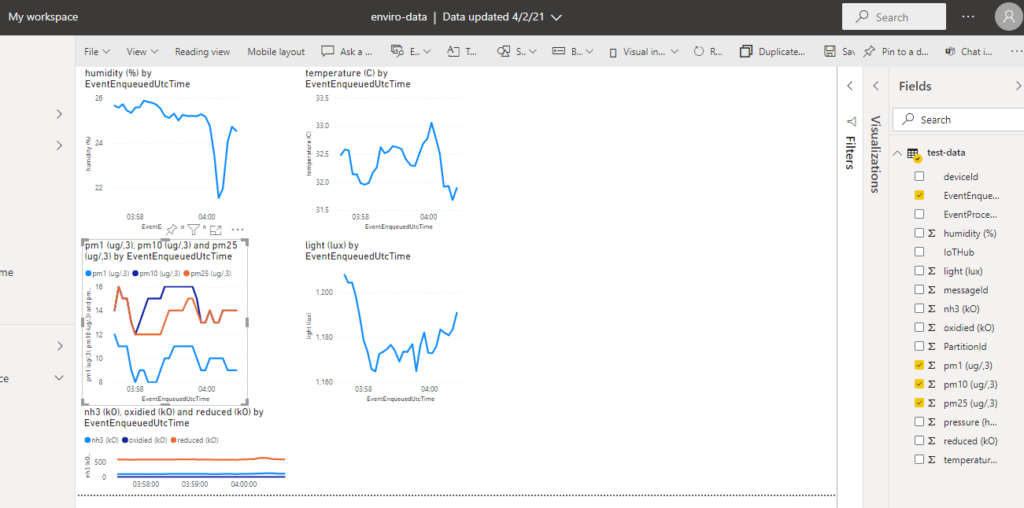
And there we have it. The next steps for us on this project will be to use this to capture data over our city and map the data captured and do some data analysis on it, which @Ratnanjali Sinha will be leading in being the data scientist in the house.
Hope you enjoyed my walkthrough on my weekend project, and Happy coding!
TThis project and blog was a collaboration between @Ratnanjali Sinha and @Shubham Sinha